EUDR
EU Deforestation Regulation — supply chains now demand continental evidence
Sentinel-2 + LiDAR
AI trained on airborne truth, applied continent-wide
VMAP
Powered by Terrak.io, built by ANU and Haizea Analytics
The Challenge
Monitoring forests underpins a growing list of policy and commercial decisions — national greenhouse accounting, biodiversity conservation, land-use planning, and increasingly, deforestation-free supply chains. For example, the EU Deforestation Regulation now requires Australian exporters to prove their supply chains are not linked to recent deforestation. Evidence must be produced, defended and refreshed for every relevant property across the entirety of Australia — a landmass nearly twice the size of the EU — and it must hold up to scrutiny from regulators, auditors and trade partners.
Remote sensing is the only viable source at that scale, but using it well is not easy: high-resolution, up-to-date, cloud-free, radiometrically consistent, analysis-ready observations have to be assembled from a continuous stream of raw scenes. The resulting archives reach tens of petabytes, so any operational product must also solve the engineering problem of storing, processing and repeatedly rerunning that archive at national scale.
The Solution
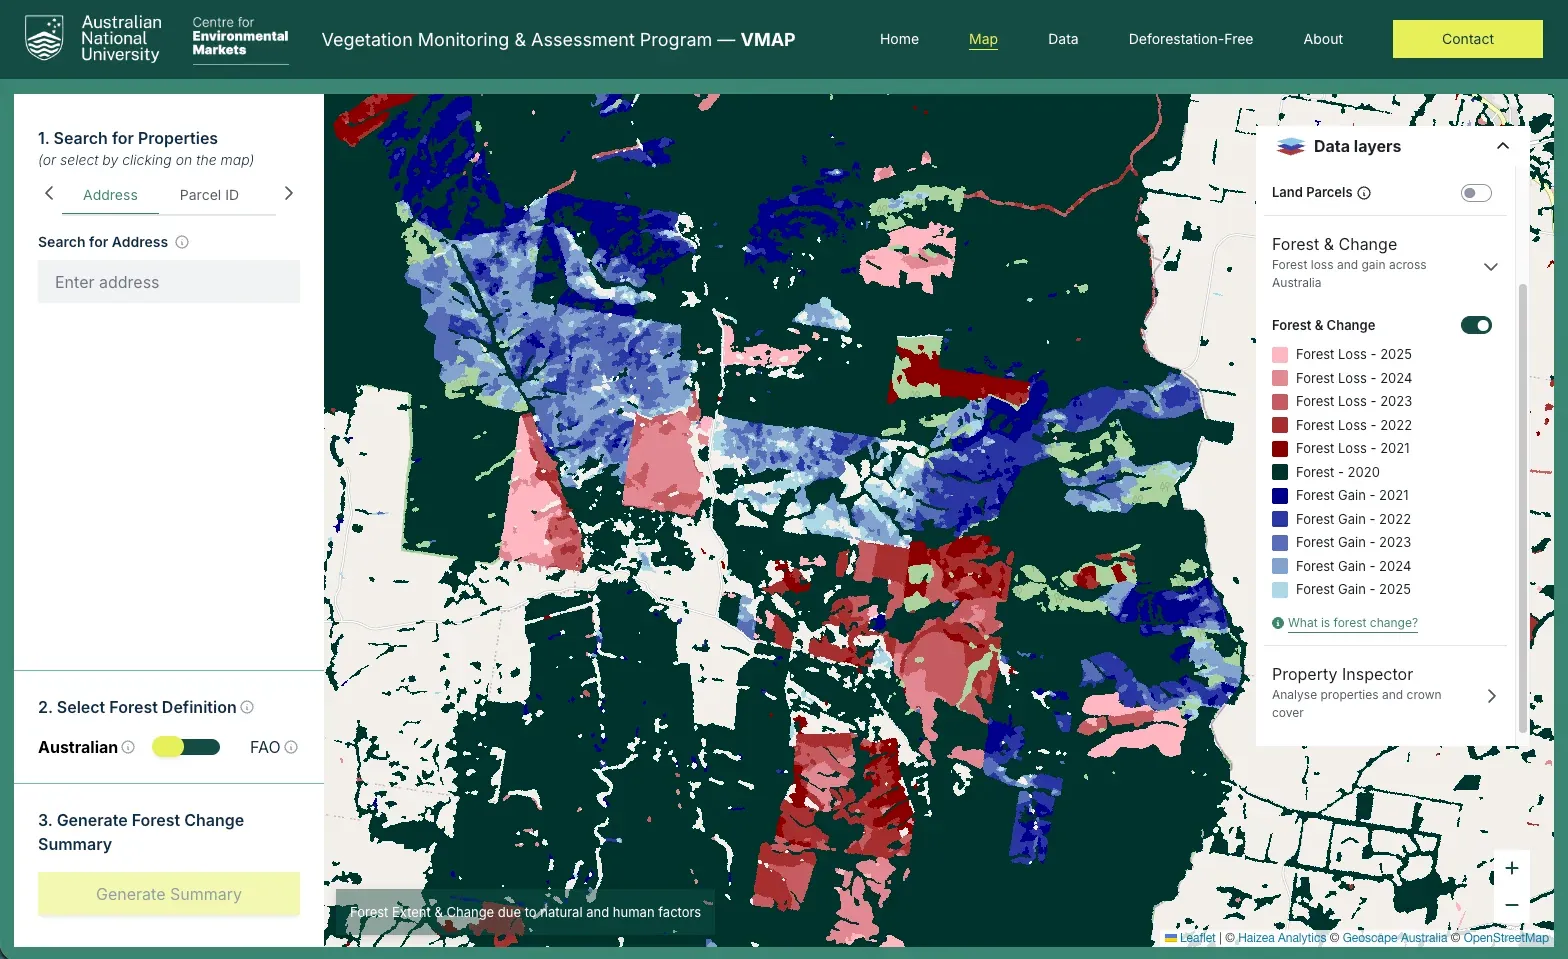
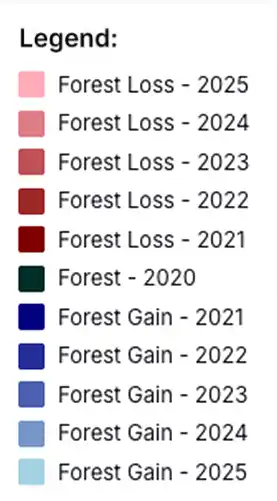
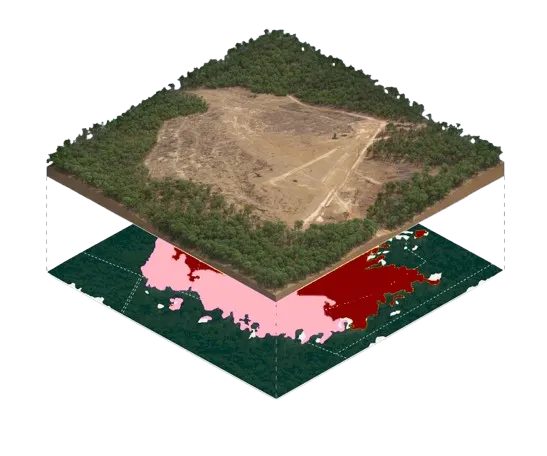
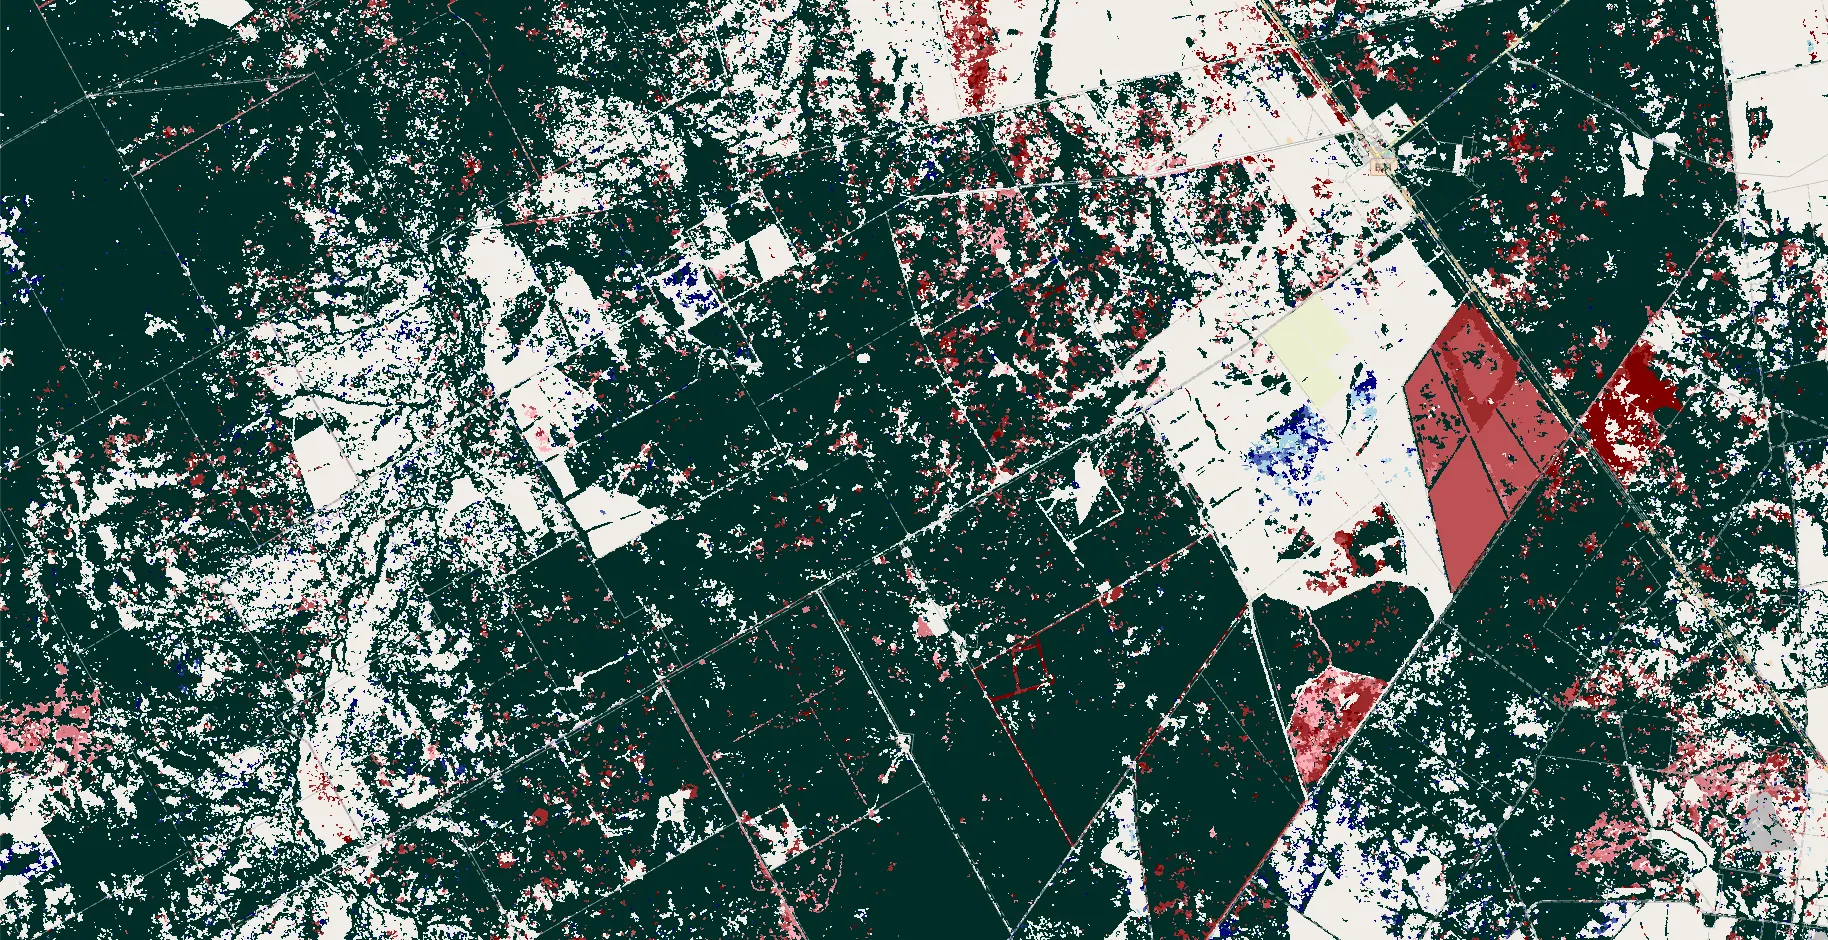
The Australian National University and Haizea Analytics developed VMAP — the Vegetation Monitoring and Assessment Program — to meet that challenge. It is an accurate, annually updated, high-quality product that maps forest extent and forest loss across the whole of Australia since 2020. The platform also includes a tree crown cover dataset extending back to 2017, and all data is freely accessible for non-commercial use.
Analysis-Ready Sentinel-2 on Terrak.io
Terrak.io hosts the full Sentinel-2 archive as a single queryable resource. Users describe the analysis they want, not the plumbing: no tile downloads, no grid alignment, no cloud masking.
Airborne LiDAR as Ground Truth
Publicly available airborne LiDAR surveys give centimetre-scale vertical structure for slices of the continent. Those surveys are used to label what forest actually looks like from space — a training signal far richer than photo-interpreted polygons.
AI Trained and Scaled on One Engine
AI models are trained and optimised directly against Terrak.io's training-sample and batch pipelines, then run annually at national scale. The same engine serves the model at an interactive tile, a national GeoTIFF or a per-property zonal statistic.
The result is a suite of vegetation products with continental coverage, annual updates and a reproducible, LiDAR-grounded methodology — produced on the same platform that serves it, so every layer is traceable back to the pixels and the model that generated it.
How It Works
Analysis-ready Sentinel-2, airborne LiDAR labels and AI models — trained, run and delivered on the same engine, once a year, for the whole continent
Analysis-Ready Sentinel-2
The full Sentinel-2 archive is hosted on Terrak.io and exposed as a single queryable resource — clean, cloud-masked and time-aligned — so downstream steps see a consistent continental raster rather than isolated raw scenes.
LiDAR-Derived Training Labels
Airborne LiDAR surveys give centimetre-scale vertical structure for slices of the continent. Those surveys are turned into high-quality labels of what forest actually is — a better training signal than photo-interpreted polygons.
AI Model Training on Terrak.io
AI models are trained and optimised directly against Terrak.io's training-sample pipeline, which materialises pixel values at labelled points at continental scale — so the model sees the same data representation it will run on in production.
Annual National Inference
Once a year the trained model is run over the whole of Australia through Terrak.io's batch orchestrator, producing a fresh forest extent and loss layer for the full continent, versioned against previous years.
Standards-Compliant Delivery
The output layers are served back through the same engine as OGC WMS, XYZ web-map tiles, GeoTIFF or NetCDF over any polygon, and CSV zonal statistics — so VMAP drops straight into GIS, web-mapping libraries and compliance workflows.
VMAP in action
Government policy: VMAP gives Commonwealth and state agencies an independent, continentally consistent reference for forest extent and loss — useable in greenhouse accounting, biodiversity reporting and land-use policy without waiting on bespoke studies.
NGO advocacy and landscape programs: WWF and partner organisations use VMAP to quantify forest loss in priority landscapes, target restoration programs and hold commitments accountable working with the same evidence base as government and industry.
Commercial due diligence: Exporters, traders and their auditors draw on VMAP's forest-loss record as one input to due diligence under the EU Deforestation Regulation (EUDR). Forest loss as mapped by VMAP does not by itself constitute deforestation under regulatory definitions — site-level assessment is still required — but a transparent, annually refreshed, continent-wide baseline makes that assessment far more tractable.
Reproducible science: The same analysis-ready Sentinel-2 stack, LiDAR labels and Terrak.io pipelines that produce VMAP are available to researchers — so follow-on science builds on the same foundations rather than starting from raw scenes.
Explore Our Case Studies
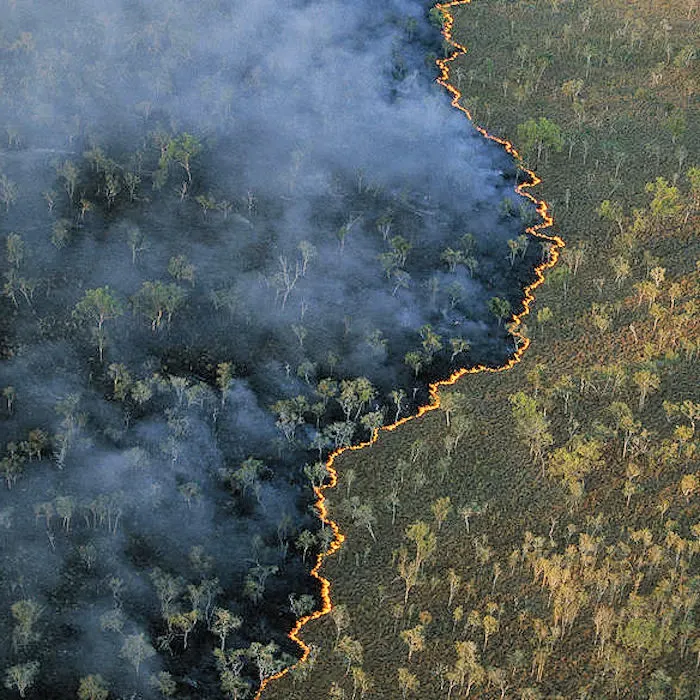
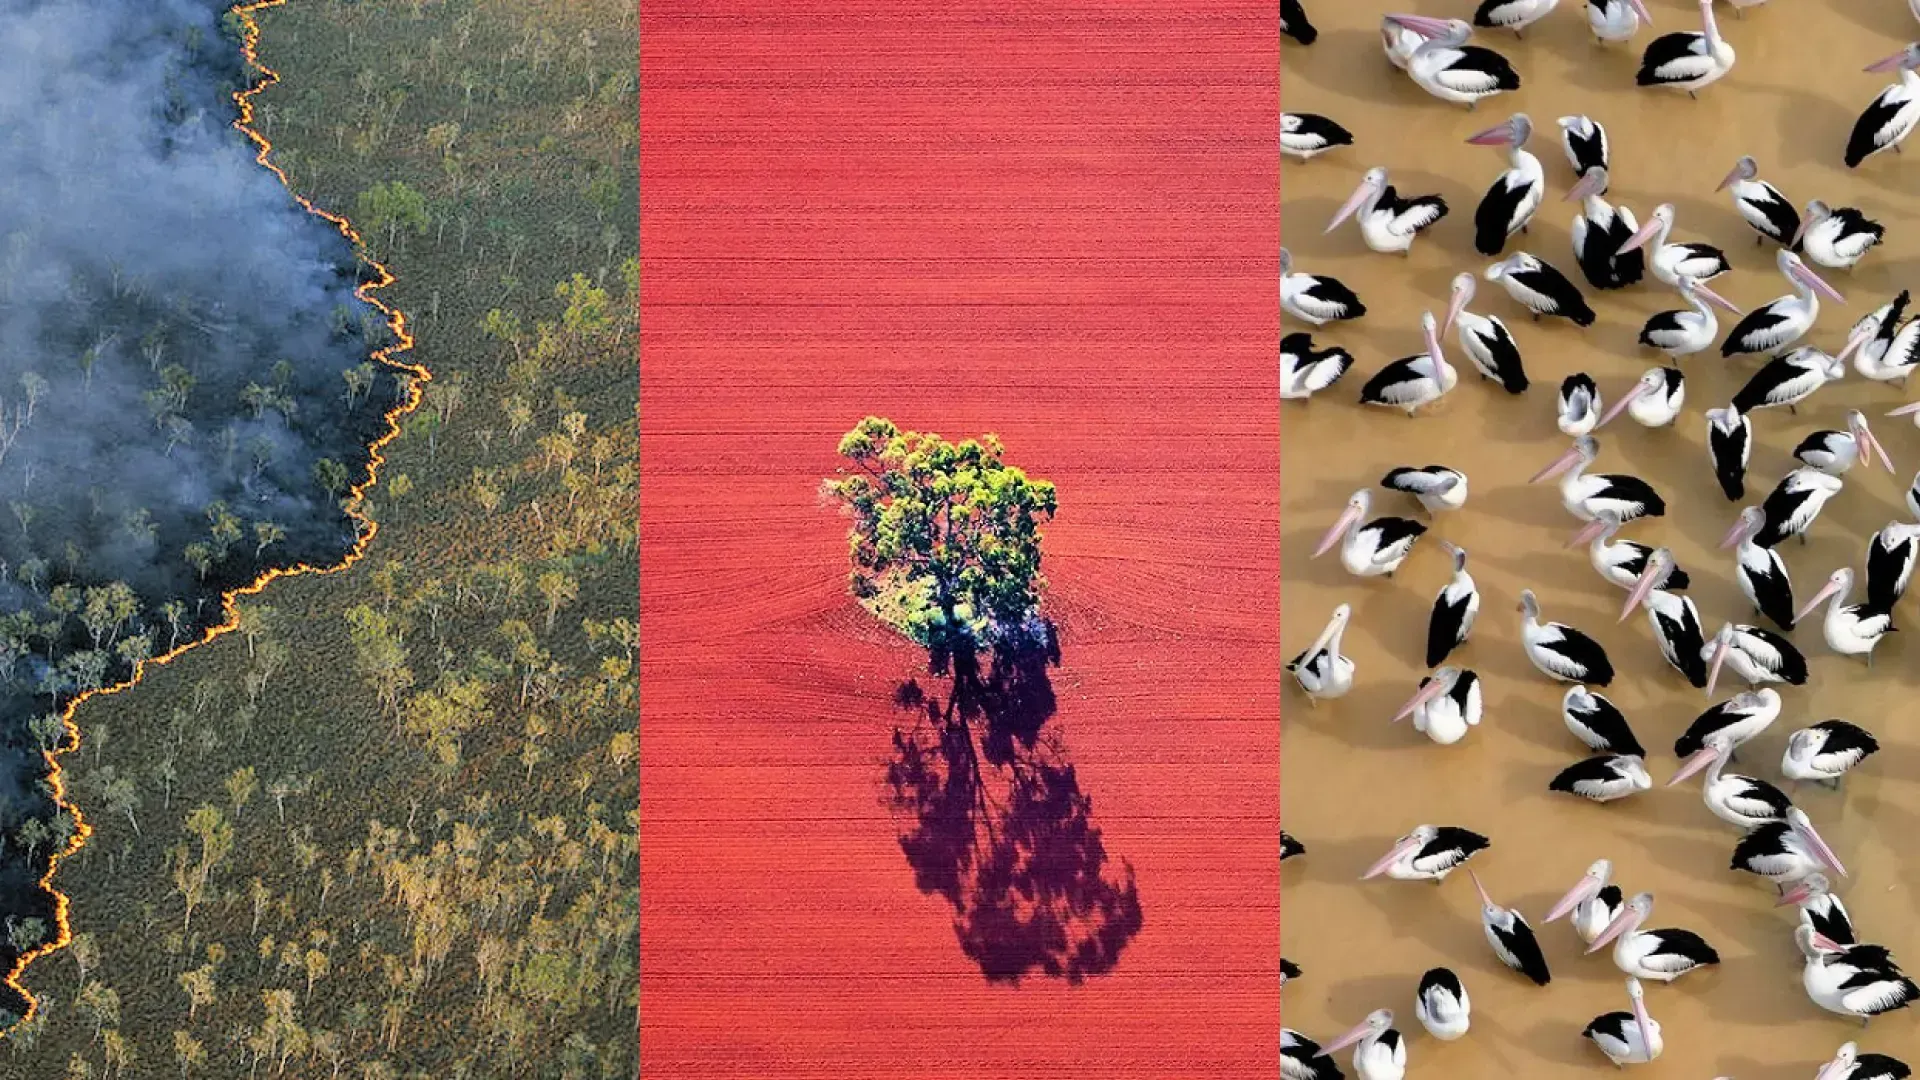
Continental bushfire intelligence with an AI agent
OzHazard — Terrakio Agent in production
Water license compliance monitoring in NSW
Government Water Authority
Evidence-based environmental policy in the ACT
ACT Government Sustainability
Annual environmental reporting across Australia
TERN & ANU Environmental Monitoring
Let us help you understand vegetation change in your area
VMAP demonstrates what's possible when analysis-ready satellite data, AI models and cloud-native infrastructure come together at continental scale. Haizea Analytics builds the same kind of evidence-based monitoring solutions for governments, NGOs and commercial organisations — whether the challenge is vegetation, water, fire or land use.